Multirotor
Multirotor precision landing under wind gust disturbances
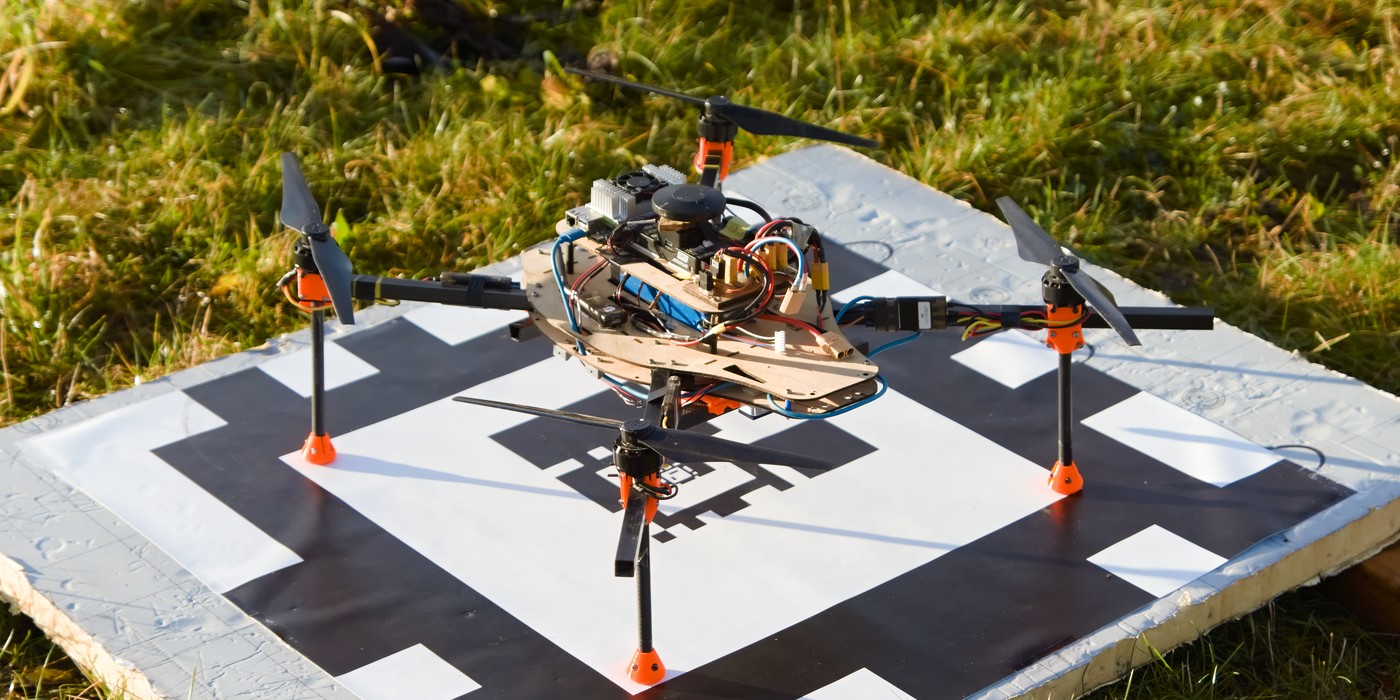
For my master’s thesis I delved into the challenge of landing a multirotor as accurately and precisely as possible on a marker while it is being disturbed by wind gusts. My work on this subject can be split into two major parts: an improved state estimator and the modeling of the disturbance impact. As a logical extension, the latter includes tuning the controller based on this model via an optimization approach. The following two sections briefly discuss these two parts.
This master’s thesis constituted the keystone of my studies in mechanical engineering at KU Leuven, and I greatly appreciate the assistance provided by my supervisor prof. Jan Swevers and assistant-supervisors Mathias Bos and dr. Bart Theys. The thesis text titled Robuust, autonoom en precies landen van een multirotor bij verstoringen door windvlagen is available in the KU Leuven library.
State estimation
Multirotor state estimation concerns the process of using the available sensor data (IMU, camera, etc.) to derive a numerical estimate of particular variables (velocity, position, etc.) used by the controller, which in turn uses this information to regulate the motors. Traditionally, there are two approaches: the GNSS-centric and the camera-centric estimators, each discussed further on. My contribution consists of providing an estimator that merges these two approaches, delivering the advantages of both without the complexity associated with running two estimators in parallel or any switching. The new estimator was validated by using it as the data source for a feedback controller and executing real-life landings with it in an outdoor environment.
The three figures below visualize the information flow in respectively the camera-centric, the GNSS-centric and the newly developed approach. The camera-centric approach works very well, however the marker should be observable by the camera. This approach thereby has to be combined with a second (GNSS-capable) estimator, doubling the system complexity, especially as having two estimators requires additional functionality to switch between the two.
The GNSS-centric approach solves this issue partially. A second, simple estimator for estimating the marker pose is added, which estimates the marker pose with good accuracy. However, the marker observations are not used in deriving the drone velocity estimate. This becomes problematic in gusty environments because the controller relies heavily on this velocity estimate to reject wind gust disturbances.
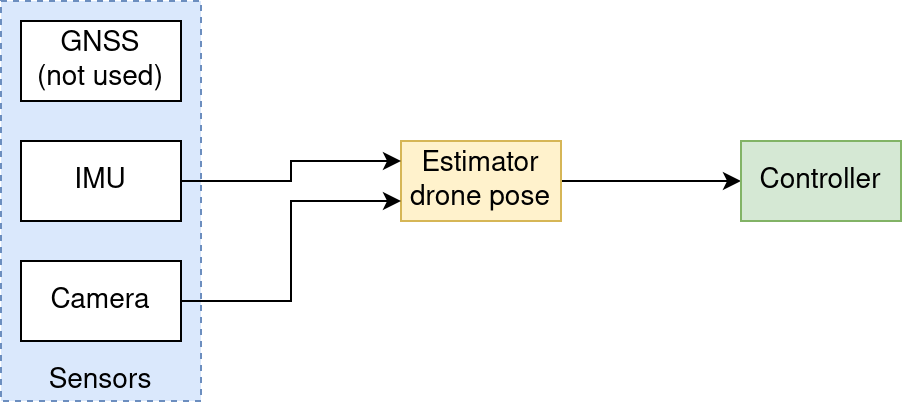
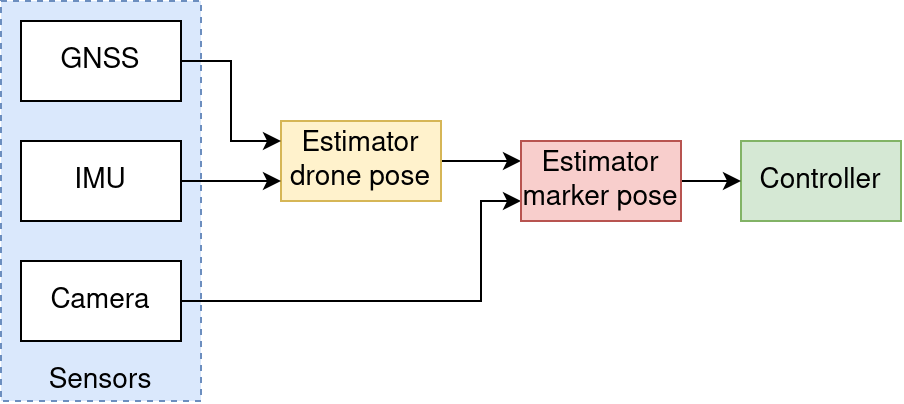
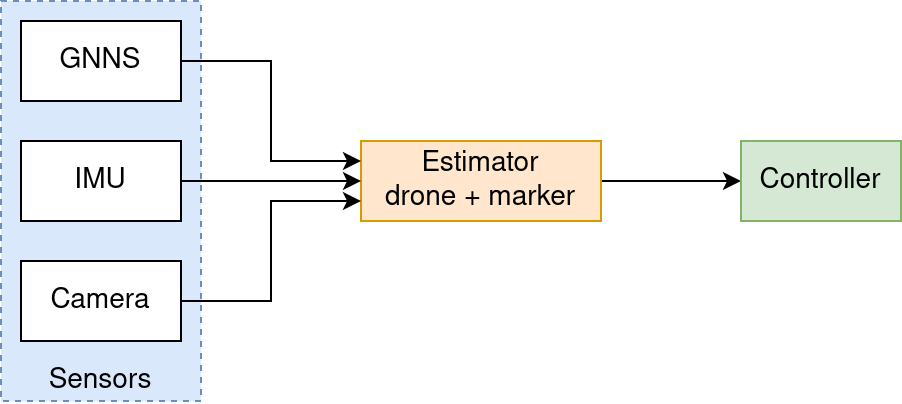

Combining the three sensors in a single estimator appears logical, yet it comes with a catch. Both camera and GNSS sensors provide a position estimate, respectively relative to the marker and to the earth (for example WGS84). Simply fusing them therefore results in a reference system conflict, as the marker position relative to the earth remains fixed, leading to estimate jumps as the marker moves in and out of the camera observation range.
This challenge was addressed by modelling the marker position relative to the earth as a random walk. This makes marker relative position to the earth part of the estimate, avoiding any conflict. Algorithmically the estimator was formulated as an extended Kalman filter (EKF). The Kalman filter varies its correction gains based on the covariance matrix, which represents the estimate uncertainty. As the estimate uncertainty changes over time, the gain matrices adapt quasi-continuously, ensuring smooth transitions as the marker moves in and out of view.
Aside of this new sensor combination approach, the developed estimator has all the usual features such as quaternion orientation representation (including a multiplicative error state), indirect prediction, asynchronous measurement updates, measurement time delay correction and correction smoothing. The estimator was implemented as a ROS node. Landing experiments where the actual landing error was compared with the estimated one yield an estimation error of less than 22 mm. The velocity estimate is roughly tenfold more accurate than the existing ArduCopter EKF-2 estimator (this large difference is caused by the camera marker observations exhibiting orders of magnitude less noise than the GNSS sensor, and the developed estimator making use of the camera).
Disturbance impact modelling and tuning optimization
The goal of this part was to design a controller that rejects external disturbances present in a normal outdoor environment as effectively as possible to minimize the landing position error. This challenge was tackled by a combination of two subparts. The first subpart concerns the development of a quantitative model that predicts the landing error in function of the present disturbances, the multirotor controller parameters, and a small set of the multirotor properties such as mass and drag coefficient. The second subpart consists of formulating the controller tuning as a minimization problem with the landing position error as the objective, the controller parameters as independent variables, and system stability criteria and the motor actuation limits as constraints.
The majority of works about multirotor control discuss a slightly different problem, namely the tracking problem, which concerns the challenge of following a desired reference trajectory while neglecting external disturbances such as wind gusts. In the case of landing the multirotor as is done in this thesis, the trajectory to track is a straight line, a trajectory that can be tracked without any particular difficulty.
The multirotor system was analyzed following the classical linear control theory principles, leading to the derivation of the disturbance sensitivity transfer function \(S_d(s)\), which describes the sensitivity of the position to acceleration disturbances. Figure 4 visualizes this function for two controllers. Left plot is a bode plot with logarithmic axes while the right plot shows the power transmission factor with linear axes. Both controllers show a clear peak from around 0.1 to 0.3 Hz. This means the multirotor system, in feedback control, is most sensitive for acceleration (or force) disturbances around this frequency. As the disturbances such as wind gusts tend to have a wide spectrum, these transfer curves are representative for the position error power spectrum. The sensitivity peak around 0.2 Hz corresponds well with the executed outdoor flight experiments in which the multirotor hovered steady above the marker, where it was observed that the main frequencies in the position error period did lie around 0.1 Hz (8 second period).
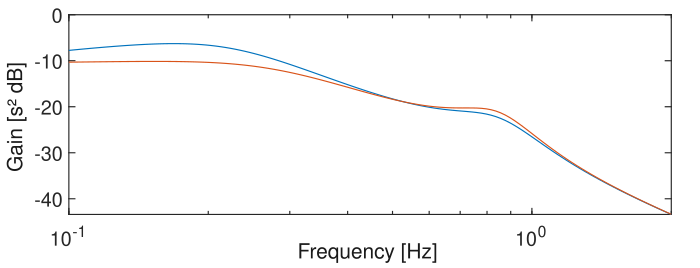
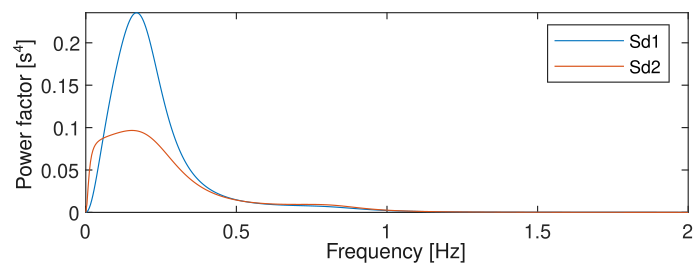
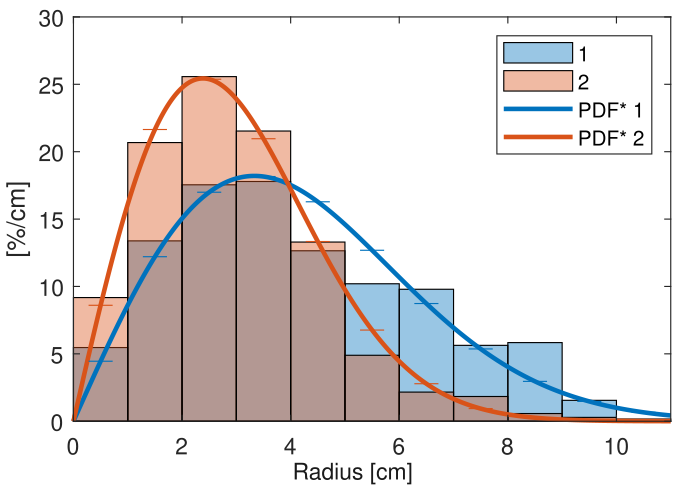
The application of the power spectral density (PSD) integral allowed for the calculation of the expected position error standard deviation from the disturbance sensitivity function \(S_d\) and the disturbance noise density spectrum. The controller was subsequently optimized using this model, and the performance of the new controller was compared with the existing one by letting the multirotor hover above the marker. The two histograms in Figure 5, from left to right, show the normal and cumulative histograms of the position error expressed as the radius. Of note is that these experimentally derived histograms adhere well to the expected Rayleigh distribution, visualized in the figures by its density functions (PDF and RCDF, solid lines), confirming that the system behaves mostly linearly despite the presence of turbulence and other complex aerodynamic effects. Also interesting is that the red controller, the one derived using optimization, delivers, on average a smaller position error, in line with the modeled sensitivity function. Both the expected and observed reduction in position error are about 17 %.
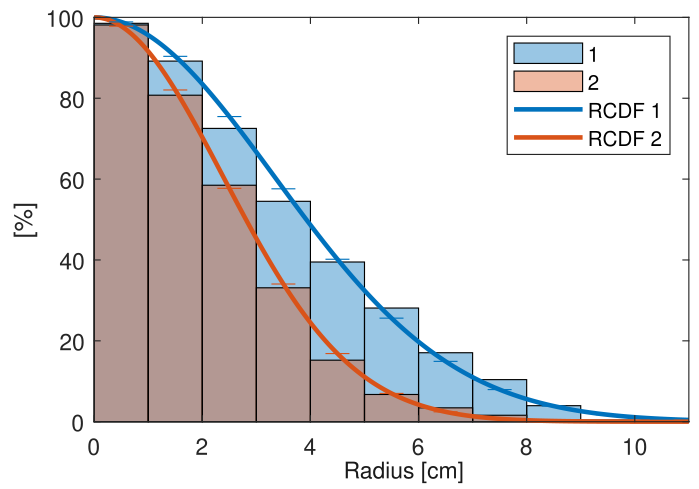
Landing position error
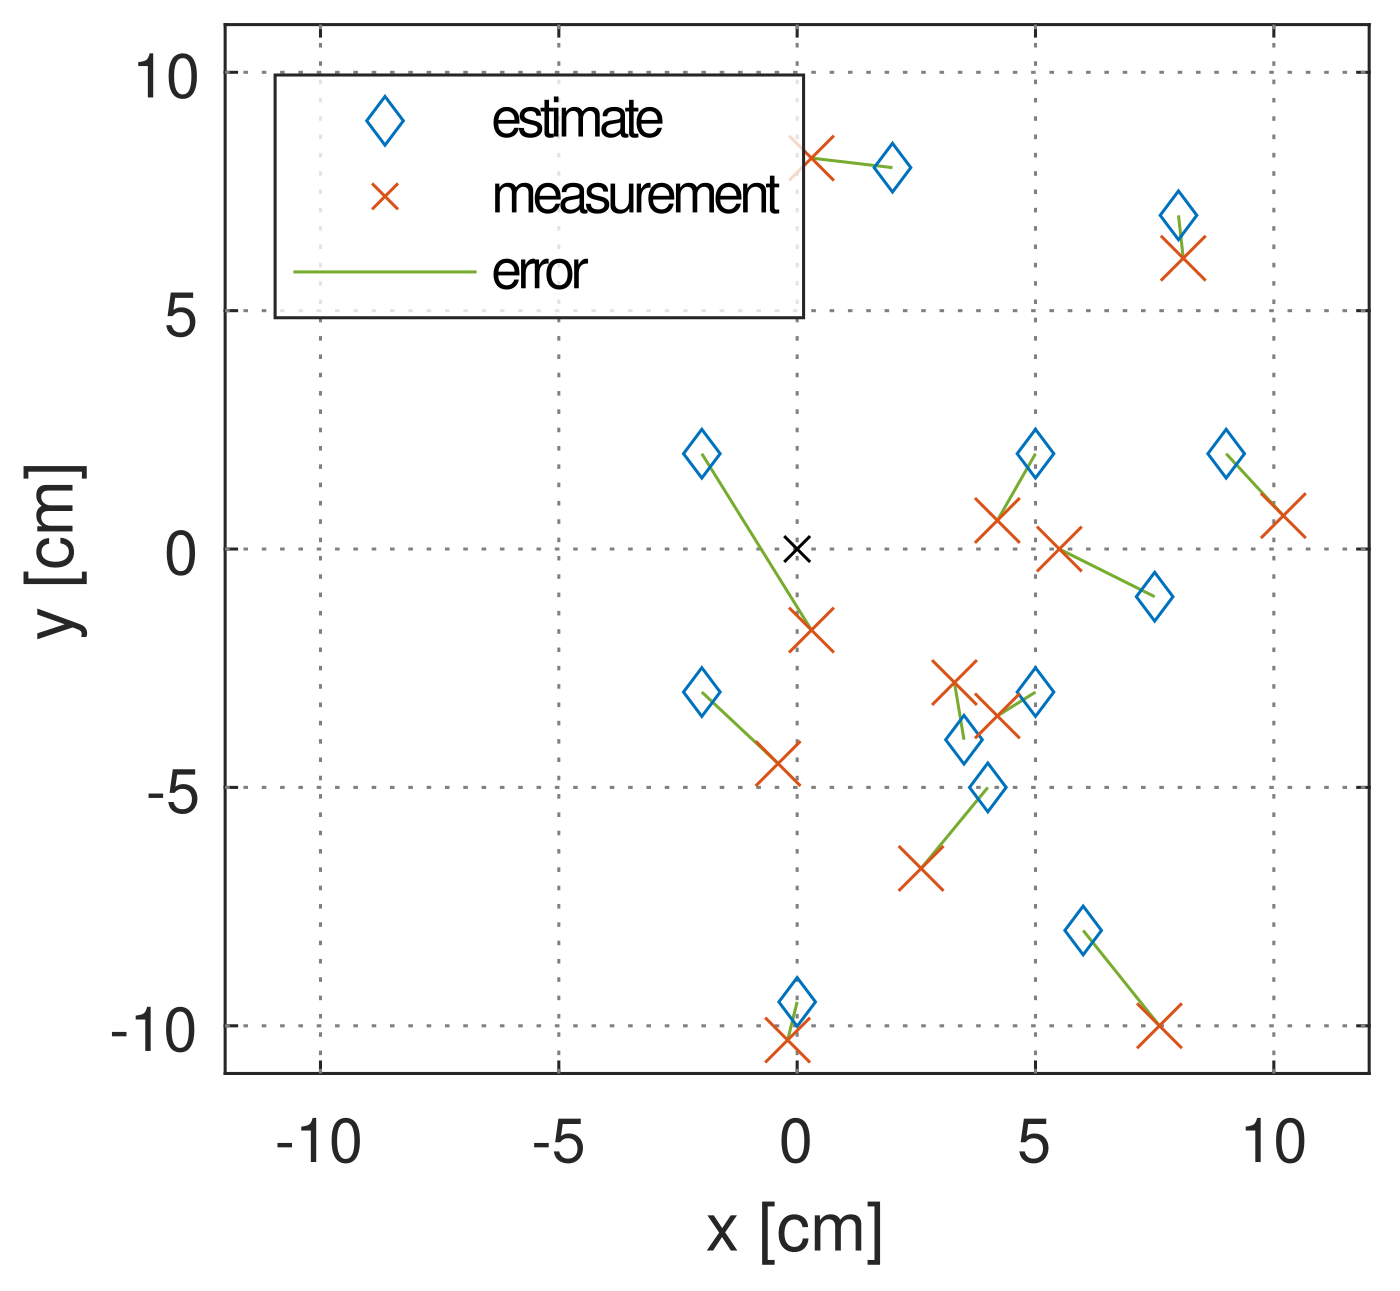
Aside from the hovering tests, landing tests were conducted where the final landing position was measured manually. Figure 6 visualizes the results of one such experiment. The root mean square (RMS) of the position error radius was 8 cm, an excellent result for an outdoor landing.
